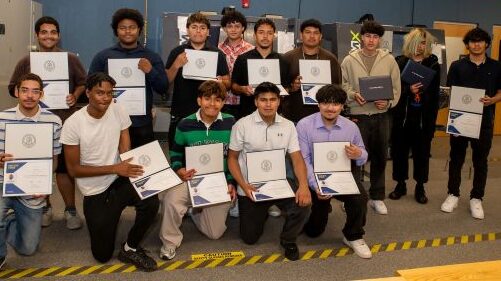
Turn Data Into Opportunity
Unlock the skills that businesses rely on every day to make smarter decisions. Our Data Analytics & Visualization program is designed for learners who want practical, job-ready training that leads directly to career opportunities in the growing field of data analytics.
Whether you’re new to data or looking to level up your skills, this program gives you the tools, confidence, and hands-on experience employers look for.
✅ Workforce-Focused Curriculum
Every course is designed with employer needs in mind. Students learn the tools and techniques used in real-world analytics roles today.
✅ Hands-On, Practical Training
You’ll work with real datasets and complete portfolio-ready projects that demonstrate your skills to potential employers.
✅ High-Demand Career Skills
Graduates are prepared for entry-level roles such as Data Analyst, Business Intelligence Analyst, Reporting Specialist, and more.
✅ Supportive Learning Environment
Instructors with industry experience help you build confidence as you learn new tools and apply them to real problems.
Who Should Enroll?
- Career changers looking to enter a growing, high-demand field
- Professionals who want to upskill for promotion or new opportunities
- Anyone curious about using data to solve problems and tell compelling stories
To obtain your certificate, you must take all five courses. Classes may be taken in any order over several semesters, or in the order below in one semester.
What You’ll Learn
✔ Excel for Business Analytics
Build a strong foundation in data cleaning, analysis, and reporting using Excel—still one of the most widely used tools in the industry.
✔ SQL for Data Management
Learn how to work with real databases and write SQL queries to extract, join, and analyze data. SQL is one of the top skills requested in analytics job postings.
✔ Power BI for Business Intelligence
Create interactive dashboards and reports that help organizations make data-driven decisions. Power BI is rapidly becoming the standard BI tool in many industries.
✔ R Programming for Data Analysis
Develop beginner-friendly programming skills to perform data cleaning, visualization, and basic statistical analysis.
✔ Tableau Desktop Specialist Preparation
Learn how to build clear, engaging visualizations and dashboards using Tableau—one of the most popular tools for data storytelling.
Courses
Business Analytics with Excel (CPC-629E)
PREREQUISITE: Proficient/intermediate knowledge of MS Excel. Microsoft 365 or the latest version is required. Course files are not compatible with older versions of Excel (e.g. 2024, 2021, 2019).
Learn how Excel can be applied to real-world business data analysis. This course will cover importing and cleaning data with Power Query, using XLOOKUP and filter lookup functions, applying conditional formulas, and working with What-If Analysis tools such as Scenario Manager, Data Tables, and Goal Seek. Students will also practice forecasting techniques to predict future sales and prices, and create pivot tables, dashboards, and data visualizations. Additional topics include Power Pivot, Python in Excel, Macros, and Analyzing Datasets with AI.
INSTRUCTOR: Alyse Cutler, MBA
Tuesdays and Thursdays, January 13-20, 2026 from 6:30-8:30 p.m.
3 sessions: 6 hours, CEU 0.6
Remote-live
Cost: $299
Power Business Intelligence (BI) (CPC-664E)
PREREQUISITE: General understanding of Microsoft Excel.
This hands-on course introduces students to Microsoft Power BI, one of the most widely used business intelligence tools for transforming raw data into compelling, interactive visualizations and dashboards. Designed for aspiring data analysts and professionals in business or technical fields, the course emphasizes practical skills in data connection, transformation, modeling, and visualization. The instructor will provide instructions on how to download the free Power BI Desktop software from the Microsoft App Store.
Instructor, Alyse Cutler, MBA
Tuesdays and Thursdays, January 27-February 5, 2026 from 6:30-8:30 p.m.
4 sessions: 8 hours, CEU 0.8
Remote-live
Cost: $349
SQL for Data Management (CPC-665E)
PREREQUISITE: Intermediate computer knowledge.
This course provides a practical introduction to Structured Query Language (SQL), a foundational tool for accessing, managing and analyzing data stored in relational databases. Designed for students pursuing careers in data analytics, business intelligence, or data-driven decision making, the course focuses on writing queries to extract insights from real-world data.
Instructor: Mike Hodgetts, MS, MBA
Tuesdays and Thursdays, February 10-19, 2026 from 6:30-8:30 p.m.
4 sessions: 8 hours, CEU 0.8
Remote-live
Cost: $349
Introduction to R Programming (CPC-631E)
PREREQUISITE: Proficient knowledge of Microsoft Excel.
R’s widespread popularity to analyze large data sets makes it an essential tool in almost every field. This course will cover exploratory data analysis techniques, visualization methods, modeling and ideas in reproducible research using packages from base R. Students will learn the basic syntax for R and how functions and packages work.
INSTRUCTOR: Mike Hodgetts, MS, MBA
Tuesdays and Thursdays, February 24-March 3, 2026 from 6:30-8:30 p.m.
3 sessions: 6 hours, CEU 0.6
Remote-live
Cost: $299
Tableau Desktop Specialist (CPC-662E)
Prerequisite: Intermediate Excel knowledge.
Tableau is a business intelligence (BI) visualization tool that helps you analyze data, create interactive visualizations, dashboards, and stories to improve processes and make smarter business decisions. Some jobs that use Tableau include Data/BI Analysts, Data Scientists, Supply Chain Analysts, Demand Planners, Financial Analysts, Marketing Analysts, HR/People Analysts, Operations Managers, and Reporting Analysts, as well as many roles in healthcare, sales, and management.
This hands-on course will teach participants the fundamental Tableau skills needed in the workplace and prepare them to take the Tableau Desktop Specialist (TDS-C01) certification exam. The curriculum covers key exam topics, including connecting to and preparing data with live connections, extracts, joins, and relationships; analyzing data using a variety of charts and graphs; and designing interactive dashboards and stories to effectively communicate insights. The school will provide a download link and temporary Tableau license for students to use the software. There is no coding in this course.
Instructor: Alyse Cutler, MBA
Saturdays, May 2-16, 2026 from 9:00 a.m.-1:00 p.m.
3 sessions: 12 hours, CEU 1.2
Remote-live
Cost: $749
Paying for Your Education
The Data Analytics and Visualization program at CCM has been approved by the NJ Department of Labor for NJ residents who are unemployed or underemployed and wish to receive a training voucher to pay for this program. If you are un/underemployed, click here for information on how to qualify.
About the Instructors
Alyse Cutler, MBA – Alyse has been instructing Workforce Development Data Analytics and Microsoft Office courses for County College of Morris since 2024, including Business Analytics with Excel, Power BI, Tableau, and AI for the workplace, for adult learners of all skill levels. Currently employed as a Senior Analyst at Orange and Rockland Utilities in NY, she also brings experience in supply chain management and adult instruction across multiple workforce development programs. She holds an MBA and a B.S. in Business Administration from Ramapo College of New Jersey, along with certifications in Tableau Desktop, Microsoft Azure AI Fundamentals, and CompTIA A+. Alyse looks forward to helping students and working professionals build practical tech skills through a hands-on and engaging approach, whether advancing in their current role or pursuing new opportunities.
Mike Hodgetts, MS, MBA – Mike has over 15 years of experience as a Data Science and is currently Director of Data Science for a large telecommunication provider. Mike has 4 degrees from NJIT including BS Electrical Engineering Technology, MS in Engineering Management, MBA and MS in Statistics, MS in Data Science from Northwestern University and ME in Artificial Intelligence Engineering from Stevens Institute of Technology. His strengths are building and leading effective teams to find business insights to help move the business forward in a positive direction. Mike is recognized for communicating data analytics insights and recommendations to executives that have resulted in significant savings. Mike also held 3 patents when he was an RF engineer earlier in his career.
Registration closes 3 business days before a class begins.
Please plan ahead and register before the class closes!
Refund Policy
Contact Us
Center for Workforce Development, County College of Morris
Student Community Center, Room 125
214 Center Grove Road, Randolph NJ 07869
E: wfd@ccm.edu
P: 973-328-5187